
Tracking Newsroom Drift with Massive Proxies: A Technical Guide to Detecting Headline Turnover and Editorial Change Over Time

Volodymyr Rudenko
Head of Engineering at Massive
November 18, 2025
The front page of a major news outlet is never actually fixed in relation to digital journalism. It alters hour by hour headlines come and go, and others are innocently rewritten to suit a changing story. These continuous changes are an indication of the breakneck speed of the contemporary newsroom, where the editorial priorities change alongside every new piece of news. But in spite of the prevalence of such changes, they are usually unnoticed and uninvestigated. The readers are only exposed to the latest version and not to how it came to be.
This article examines such a covert movement of the drift that takes place as news headlines change with time. We trace the changes on the front page of one news site during the day. Based on the case study of BBC.com, we gauge the frequency of changes in the top twenty headlines, the change in wording, and the rate of editorial turnover.
In order to monitor this process, we have adopted the use of ISP proxies at Massive, which is reliable and blocks free access to live sites. These proxies serve as residential, unstable internet endpoints, which enable the gathering of data without the need to cause rate limits or IP-based restrictions. This is a condition necessary in time-based measurements, and any missing snapshot may have changed the trend.
Using a repeatable Python pipeline, we are able to repeatedly take a snapshot of the BBC homepage, parse it for a list of the top post topics, and compare each new snapshot of the webpage with the previous one. We note the time of addition, removal, or alteration of headlines, and we compute a percentage of drift, which is the degree of change. These findings display the dynamism of the front page as they found that there is a quantifiable change in editorial updates.
The study of headline drift helps us better understand the way that news organizations interpret, prioritize, and modify their stories as they happen. What seems to be a motionless site is in reality a relentless stream of editorial choices and an invisible timeline that forms the social perception of contemporary events.

News in the age of digital publishing does not come as a hard copy, but as a stream of news, updates, rewrites, instability, and rearrangement. What a reader would be viewing on a homepage today can be totally different only an hour later. New developments or audience data prompt editorial teams to add and rephrase (or even substitute) stories.
This is a gradual, yet incessant change of what we call headline drift, which is a unique feature of the current news ecosystem on the internet. The knowledge of the ways and reasons it occurs provides crucial information about the work of journalists and the actions of information in a rapidly changing digital society.
A headline is frequently regarded as the point of creation of a story, the instant it is made live. In electronic newsrooms, however, publication is rather precisely the start of the life cycle of a headline. A published headline falls into a dynamic editorial space where it is common to change, and most of the time, unnoticed. These amendments can be made due to several reasons:
It is this continuous process that predisposes a digital headline to a kind of living unit of communication. However, since these edits are automatically made with the previous versions being overwritten, the history of modification is lost. Most websites do not bring out a historical image of what was altered and when, as opposed to printed newspapers that leave an old version of the news. The official record, thus, turns porous and is rewritten and largely undocumented.
In order to systematically explore this continuous change system, we can describe headline drift as the quantifiable change of a set of news headlines over time. Drift is the extent to which the collection of available headlines has changed at two snapshots of a webpage. In this article, drift is classified into 3 dimensions:
Combined, these categories characterize the rhythm of the structure of the digital output of a newsroom. Comparing sequential snapshots and calculating the fraction of change, we are able to estimate a drift percentage, which is a measure of the volatility or stability of the home page of a publication within a specified time interval.
The newsroom is viewed as a dynamic system instead of a dead-end storage of information. The homepage is turned into a legislative picture of temporality, a picture of changing editorial decisions, hierarchies of the stories, and institutional reaction to the breaking news.
Tracking headline drift provides valuable insights across multiple dimensions: journalistic, analytical, and societal.
Drift analysis helps shed light on what editorial processes behind the public information are like, but we cannot see. By reaching such times when headlines are being changed, the researchers will be able to find out:
This kind of transparency also makes it possible to learn not only what is reported but also how it changes, so that the initially invisible loops of editing become measurable phenomena.
In applications of machine learning and natural language processing (NLP), the news data is frequently scraped without considering when the data was collected. Yet headlines may vary substantially even within a day, which introduces so-called temporal noise.
Drift measurement enables analysts to:
Understanding drift offers editorial teams the benefit of diagnosing.
On a wider level, there is a link between headline drift that links directly to the public memory and perception. Readers take for granted that what they read at one moment is a lasting record, but the continuous update of online journalism means that the "record" is always rewriting itself. This affects:
By trying to describe drift as a quantifiable process, we made an abstract editorial behavior that is measurable and reproducible. Each new, deleted, or changed one of them corresponds to a data point in the dynamically changing information space of the newsroom. Collected over the past hours or days, these changes create patterns that can tell us about editorial priorities, reaction times, and cycles of attention.
This study advances that framework by taking advantage of a technical infrastructure that is capable of continuous and bias-free monitoring. Enduring Long-Term Access: Massive's ISP proxies offer busyness to external live pages without getting into the rut of rate-limiting restrictions or IP blocking practice, which is a major issue during the longitudinal episode gathering exercise. Through automation and careful timestamping, the changes in appearance of visibility are being recorded not simply through time, but the fact of time itself.
Ultimately, the goal isn't to be in a critical mode about specific editorial choices and seek to understand change in order to watch in a way that journalism writes and rewrites itself in a quantifiable form. The result is a portrait of the modern media that really does exist: not as a static thing, but as a dynamic system of information that changes just as fast as the world itself.

To work the idea of headline drift into a measurable process, the next step is to design and implement a fully automated pipeline of sorts, which could continuously watch the homepage of a newsroom, track what changes, and even measure those changes over time. This section outlines the system architecture, proxy configuration, data harvesting logic, drift detection logic, as well as the final summarization logic of the whole experiment. The code was written in Python, making the implementation completely reproducible - as well as transparent at each stage, to allow other researchers to replicate or extend this analysis.
The main aim of the experiment is therefore to trace the editorial motion of the BBC News homepage over time. The script repeatedly catches the headlines on the site's main page, compares the latest capture with the previous one, and notes the amount of change. To do this effectively, three requirements must be fulfilled by the system:
<table class="GeneratedTable">
<thead>
<tr>
<th>Parameter</th>
<th>Description</th>
<th>Value</th>
</tr>
</thead>
<tbody>
<tr>
<td>Target URL</td>
<td>Homepage under observation</td>
<td><a href="https://www.bbc.com/">https://www.bbc.com/</a></td>
</tr>
<tr>
<td>Headlines Tracked</td>
<td>Number of top-ranked news titles</td>
<td>20</td>
</tr>
<tr>
<td>Interval Between Snapshots</td>
<td>Time gap between consecutive scrapes</td>
<td>1800 seconds (30 minutes)</td>
</tr>
<tr>
<td>Observation Rounds</td>
<td>Number of total snapshots</td>
<td>11</td>
</tr>
<tr>
<td>Metrics Captured</td>
<td>Added, Removed, Modified, Drift %</td>
<td></td>
</tr>
</tbody>
</table>
This setup creates a 24-hour-long continuum of newsroom activity. Each interval is then a measurement window through which the editorial "pulse" of the homepage can be measured.
Because most major websites have strict limitations on automated requests, stable and ethical access is of critical importance. The experiment uses Massive's (the company behind ISP Proxies), which mimics real residential browsing behaviour and will prevent IP bans and regional inconsistency. The script has eight basic steps: configuration, proxy connection, headline extraction, snapshot collection, difference calculation, drift summarization, and final aggregation.
from tqdm.auto import tqdm
from bs4 import BeautifulSoup
from difflib import SequenceMatcher
import requests, time, datetime as dt, pandas as pd

# 1. Configuration
NEWS_URL       = "https://www.bbc.com/"
TOP_N          = 20           # number of top headlines to track
FETCH_INTERVAL = 1800           # seconds between fetches
MAX_ROUNDS     = 11          # how many snapshots to collect

# Massive ISP proxy credentials (provided)
USE_PROXY  = True
PROXY_HOST = "isp.joinmassive.com"
PROXY_PORT = 8000
PROXY_USER = "your_proxy_username"
PROXY_PASS = "your_proxy_password"

HEADERS = {"User-Agent": "Mozilla/5.0 (Windows NT 10.0; Win64; x64) "
           "AppleWebKit/537.36 (KHTML, like Gecko) "
           "Chrome/124.0.0.0 Safari/537.36",
           "Accept-Language": "en-US,en;q=0.9",}

# 2. Proxy Builder + Test
def build_proxies():
    if not USE_PROXY:
        return None
    auth = f"http://{PROXY_USER}:{PROXY_PASS}@{PROXY_HOST}:{PROXY_PORT}"
    return {"http": auth, "https": auth}

proxies = build_proxies()

try:
    r = requests.get("http://ip-api.com/json", proxies=proxies, timeout=15)
    print("Proxy connected:", r.json().get("query"), "-", r.json().get("country"))
    except Exception as e:
    print("Proxy check failed:", e)

    # 3. Headline Extractor
def extract_bbc_headlines(html: str, top_n: int = TOP_N) -> pd.DataFrame:
    soup = BeautifulSoup(html, "html.parser")
    items = []
    for a in soup.select("a:has(h2), a:has(h3)"):
        text = a.get_text(strip=True)
        href = a.get("href")
        if not text or not href:
            continue
        if href.startswith("/"):
            href = "https://www.bbc.com" + href
        items.append((text, href))
    seen, uniq = set(), []
    for t, u in items:
        key = (t, u)
        if key in seen:
            continue
        seen.add(key)
        uniq.append((t, u))
        if len(uniq) >= top_n:
            break
    df = pd.DataFrame(uniq, columns=["title", "url"])
    return df

    # 4. Snapshot Fetcher
def fetch_snapshot() -> pd.DataFrame:
    resp = requests.get(NEWS_URL, headers=HEADERS, proxies=proxies, timeout=25)
    resp.raise_for_status()
    df = extract_bbc_headlines(resp.text, TOP_N)
    # timezone-aware UTC timestamp (readable)
    try:
        ts = dt.datetime.now(dt.UTC).strftime("%Y-%m-%d %H:%M:%S UTC")
    except AttributeError:
        from datetime import timezone
        ts = dt.datetime.now(timezone.utc).strftime("%Y-%m-%d %H:%M:%S UTC")
    df.insert(0, "rank", range(1, len(df) + 1))
    df["timestamp"] = ts
    return df

    # 5. Diff Detector
def diff_with_details(old_df: pd.DataFrame, new_df: pd.DataFrame, sim_threshold: float = 0.82):
    merged = old_df.merge(new_df, on="url", how="outer", suffixes=("_old", "_new"), indicator=True)
    added, removed, modified = [], [], []

    for _, row in merged.iterrows():
        if row["_merge"] == "left_only":
            removed.append({"title": row["title_old"], "url": row["url"]})
        elif row["_merge"] == "right_only":
            added.append({"title": row["title_new"], "url": row["url"]})
        else:
            if row["title_old"] != row["title_new"]:
                sim = SequenceMatcher(None, row["title_old"], row["title_new"]).ratio()
                if sim < sim_threshold:
                    modified.append({
                        "title_from": row["title_old"],
                        "title_to": row["title_new"],
                        "url": row["url"]
                    })

    added_df    = pd.DataFrame(added,   columns=["title", "url"])
    removed_df  = pd.DataFrame(removed, columns=["title", "url"])
    modified_df = pd.DataFrame(modified,columns=["title_from","title_to","url"])

    baseline = max(len(old_df), 1)
    drift_pct = (len(added_df) + len(removed_df) + len(modified_df)) / baseline * 100.0
    metrics = {"added": len(added_df),"removed": len(removed_df),"modified": len(modified_df),"drift_pct": round(drift_pct, 1),}
    return added_df, removed_df, modified_df, metrics

    # 6. Helper Functions for Summary
def _safe_examples(df: pd.DataFrame | None, col: str = "title", k: int = 2) -> str:
    if df is None or not isinstance(df, pd.DataFrame) or df.empty or col not in df.columns:
        return ""
    return " · ".join(df[col].dropna().astype(str).head(k).tolist())

def _snap_ts(snap_df: pd.DataFrame) -> str:
    if snap_df is None or snap_df.empty or "timestamp" not in snap_df.columns:
        return ""
    return str(snap_df["timestamp"].iloc[0])

def _auto_obs(a, r, m):
    if a + r + m == 0:
        return "No visible changes."
    s = []
    if a: s.append(f"{a} added")
    if r: s.append(f"{r} removed")
    if m: s.append(f"{m} modified")
    return ", ".join(s) + "."

def build_headline_drift_summary(interval_changes, snapshots, examples_per=2):
    rows = []
    for it in interval_changes:
        i = it["interval"]
        ts_start = _snap_ts(snapshots[i-1])
        ts_end   = _snap_ts(snapshots[i])
        met = it.get("metrics", {}) or {}
        a, r, m = int(met.get("added",0)), int(met.get("removed",0)), int(met.get("modified",0))
        drift = float(met.get("drift_pct",0))
        added_ex   = _safe_examples(it.get("added_df"),   "title", k=examples_per)
        removed_ex = _safe_examples(it.get("removed_df"), "title", k=examples_per)
        mod_df = it.get("modified_df")
        if mod_df is None or mod_df.empty:
            mod_ex = ""
        else:
            pairs = []
            for x,y in zip(mod_df.get("title_from",[]).head(examples_per),
                           mod_df.get("title_to",[]).head(examples_per)):
                if pd.isna(x) and pd.isna(y): continue
                pairs.append(f""{x}" → "{y}"")
            mod_ex = " · ".join(pairs)
        rows.append({"Interval": i,"Timestamp Start (UTC)":
        ts_start,"Timestamp End (UTC)": ts_end,"Added (Count)": a,"Added (Titles)": added_ex,
                     "Removed (Count)": r,"Removed (Titles)": removed_ex,"Modified (Count)": m,"Modified (Titles)": mod_ex,"Drift %": drift,
                     "Observation": _auto_obs(a,r,m)})
    return pd.DataFrame(rows)

    # 7. Main Loop
snapshots, interval_changes = [], []

for i in tqdm(range(MAX_ROUNDS), desc="Collecting BBC snapshots"):
    df = fetch_snapshot()
    snapshots.append(df)
    if i > 0:
        added_df, removed_df, modified_df, met = diff_with_details(snapshots[i-1], df)
        interval_changes.append({"interval": i,"added_df": added_df,"removed_df": removed_df,"modified_df": modified_df,"metrics": met})
    if i < MAX_ROUNDS - 1:
        time.sleep(FETCH_INTERVAL)

# 8. Final Headline Drift Summary
drift_summary_df = build_headline_drift_summary(interval_changes, snapshots, examples_per=2)
print("\n Headline Drift Summary Table:")
display(drift_summary_df)
Once the pipeline has been executed, the process follows a measured pattern of observation and comparison.
At both intervals, the script takes a new photo of the home page, converts it to a structured set, and determines how the home page has changed compared to the previous photo.
Every change found on the newsroom's homepage falls into three categories:
<table class="GeneratedTable">
<thead>
<tr>
<th></th>
<th>Condition</th>
<th>Interpretation</th>
</tr>
</thead>
<tbody>
<tr>
<td>Added</td>
<td>Headline appears only in the new snapshot</td>
<td>A new story has entered the homepage rotation.</td>
</tr>
<tr>
<td>Removed</td>
<td>Headline appears only in the old snapshot</td>
<td>A story has been dropped from visibility.</td>
</tr>
<tr>
<td>Modified</td>
<td>Same URL but altered headline text</td>
<td>The headline has been rephrased or reframed editorially.</td>
</tr>
</tbody>
</table>
Minor stylistic variations, e.g., punctuation, short word substitutions, are ignored. Only significant edits that are made to the content of the text in the headline and change the way it is framed will be registered as edits.
This difference keeps the count from getting inflated and allows the drift to be measured as real editorial decisions.
The drift percentage represents the general volatility of the newsroom between two newsroom snapshots. It is calculated as:
Drift, % = (Added+Removed+Modified)/Total Headlines x 100
This normalization makes it possible to compare the results in different intervals (or even from different news sources) consistently.
Higher drift percentages indicate greater Editorial Dynamics: breaking news events or major repositionings, for example; lower percentages indicate stability and continuity of the news cycle.
After each round of comparisons, the system summarizes results in a structured summary table, which delivers both quantitative and qualitative information about newsroom activity.
This phase of summarization is done in order to transform the raw comparisons into a narrative dataset, one that captures not only what changed, but how the changes are a reflection of the rhythm of the edit.
The final stage of the pipeline is aggregation, which collects all the changes that are identified between consecutive snapshots. Each row in the table is related to one observation interval resulting from evidence timestamped together with descriptive annotations.
In particular, each record contains:
This structure works to bridge support between data collection and interpretation in a process that will turn technical outputs to interpretable newsroom metrics.
Once the drift tracking pipeline has finished its prescribed rounds of observation, the product obtained by the pipeline is a transformation of the raw data of comparisons into an interpretable data signal of newsroom behavior.
This stage moves those record-keeping numbers of added, deleted, and modified stories into a visual proof of how the BBC homepage changed over time.
Through visualisation, the editorial dynamics that should have occurred become visible: periods of calm, update bursts, and periods of rapid reframing.
The automatically generated summary table of the editorial record represents the activity for each interval during the observation period in a structured way.
Each entry records the time when the changes were taking place, their direction, and how significant the change was in relative terms.
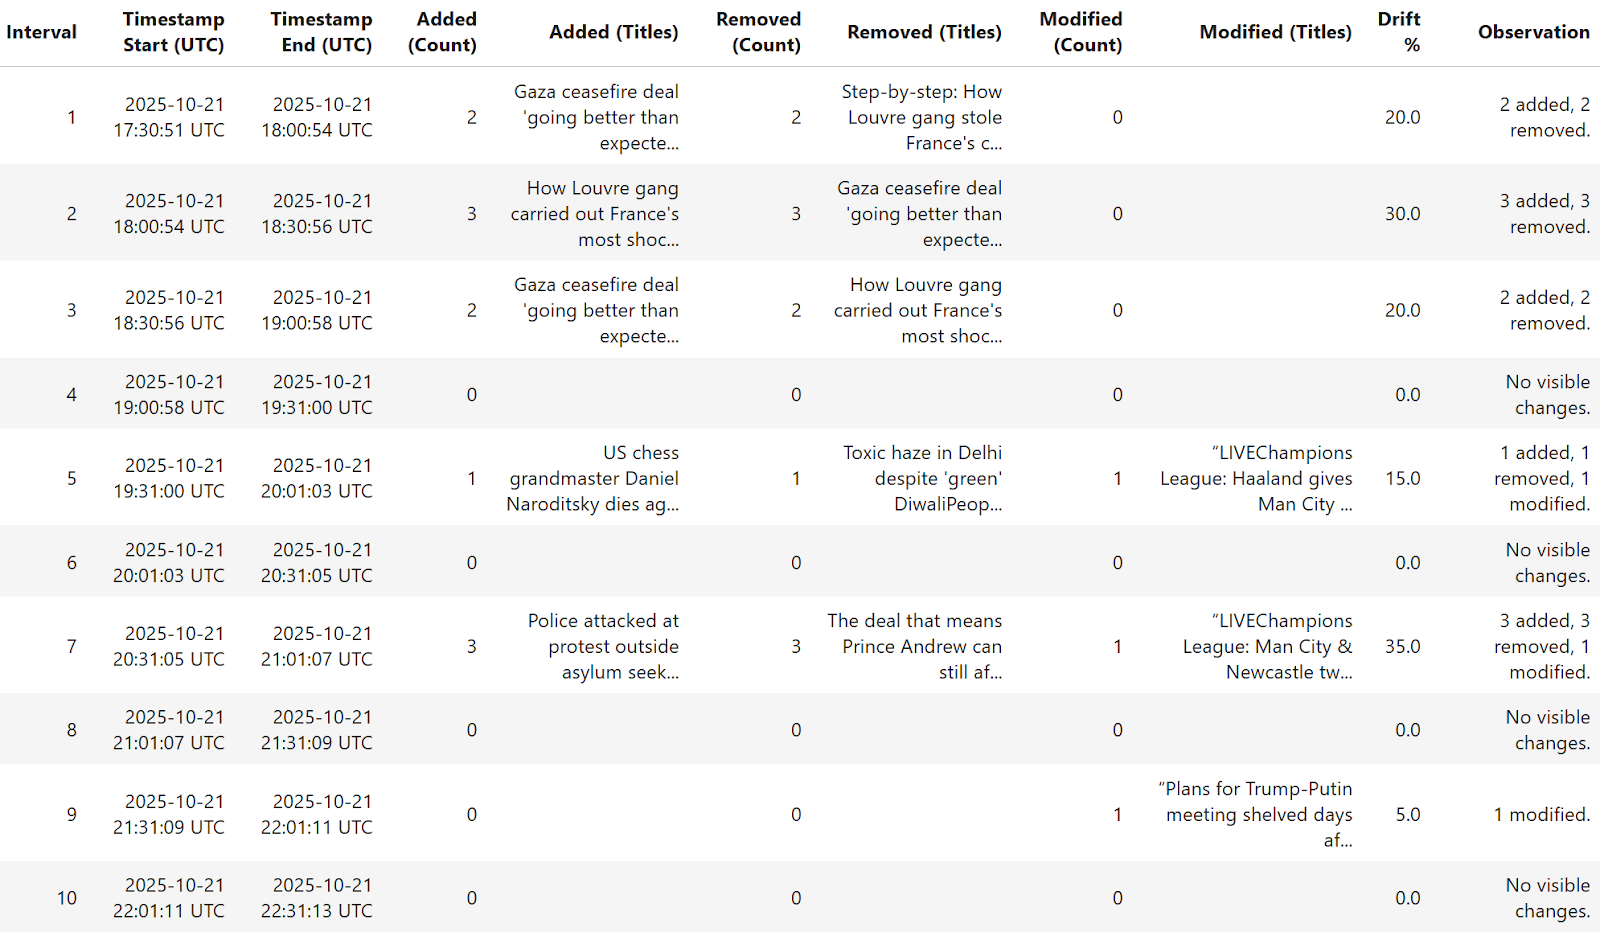
In the graph below, for example, Intervals 1-3 indicate a rotation early in the evening between coverage of both the ceasefire in Gaza and the investigation at the Louvre, and more calm stability later in the night has been noted.
The "Drift %" column measures such moments to provide some direct measure of the volatility of the front page over each period.
<table class="GeneratedTable">
<thead>
<tr>
<th>Interval</th>
<th>Start (UTC)</th>
<th>End (UTC)</th>
<th>Added</th>
<th>Removed</th>
<th>Modified</th>
<th>Drift %</th>
<th>Observation</th>
</tr>
</thead>
<tbody>
<tr>
<td>1</td>
<td>17:30</td>
<td>18:00</td>
<td>2</td>
<td>2</td>
<td>0</td>
<td>20</td>
<td>Two new stories; two retired.</td>
</tr>
<tr>
<td>2</td>
<td>18:00</td>
<td>18:30</td>
<td>3</td>
<td>3</td>
<td>0</td>
<td>30</td>
<td>High-turnover period; fresh headlines added.</td>
</tr>
<tr>
<td>3</td>
<td>18:30</td>
<td>19:00</td>
<td>2</td>
<td>2</td>
<td>0</td>
<td>20</td>
<td>Content reshuffle maintains news diversity.</td>
</tr>
<tr>
<td>5</td>
<td>19:30</td>
<td>20:00</td>
<td>1</td>
<td>1</td>
<td>1</td>
<td>15</td>
<td>Editorial fine-tuning with minor rewrites.</td>
</tr>
<tr>
<td>7</td>
<td>20:30</td>
<td>21:00</td>
<td>3</td>
<td>3</td>
<td>1</td>
<td>35</td>
<td>Major updates linked to live events.</td>
</tr>
<tr>
<td>9</td>
<td>21:30</td>
<td>22:00</td>
<td>0</td>
<td>0</td>
<td>1</td>
<td>5</td>
<td>Single reworded headline.</td>
</tr>
</tbody>
</table>
In this sense, the term "high-drift window" (e.g., Interval 7) refers to a refresh cycle of the Newsroom when breaking stories, live coverage, or evening bulletins dominate and create a series of simultaneous changes.
The short-term (e.g., 4, 6, 10) intervals are a measure of editorial stability, when the composition of the homepage tends to remain constant.
The first visualization displays headline drift percentage over time, which identifies when the BBC homepage made the most significant changes.
Each infection is reflected as an editorial refresh burst, which is an example of breaking-news windows or scheduled content rotations.
Notably:
This number, therefore, becomes a temporal pulse, which indicates the time at which the digital newsroom was most active in restructuring its front page.
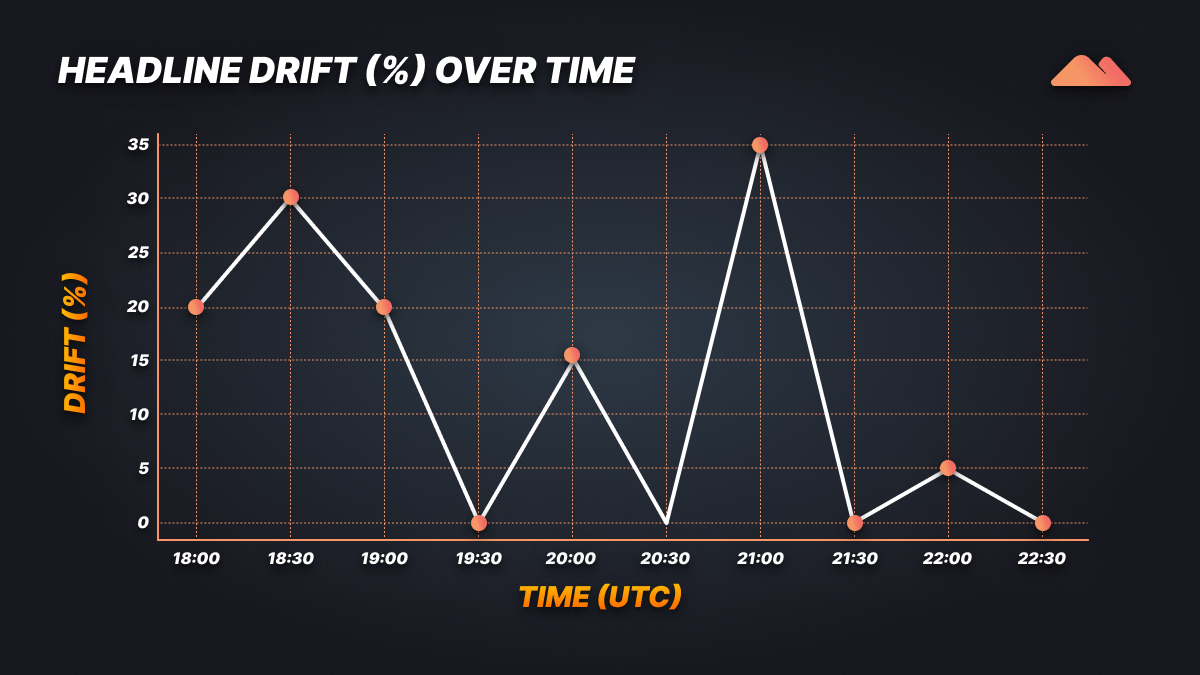
The grouped-bar view interprets the anatomy of change at both the level of each interval.
Instead of reporting a single score of volatility, it breaks down volatility into three types of editorial action being in balance:
Patterns emerge across time:
The texture of change is evidenced in the editorial; therefore, the compositional grid does not merely reveal the frequency of change.
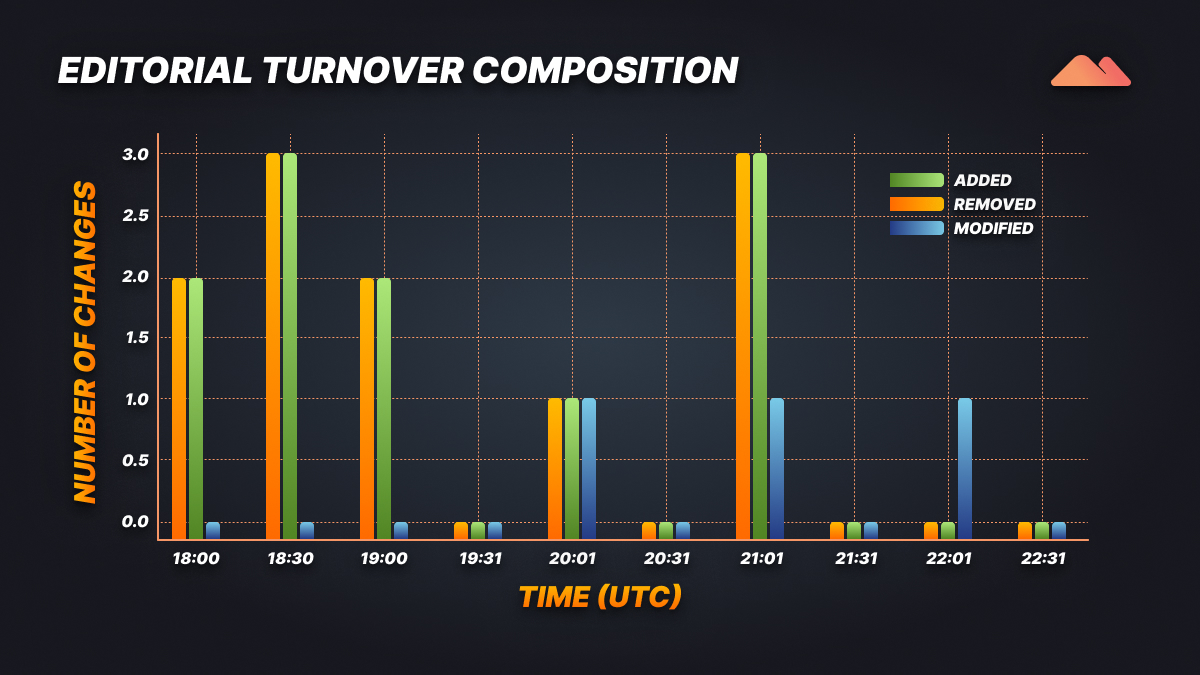
The proxy obtains aggregation support over the whole observation core by using the cumulative-drift plot, which summarizes the volatility in selected stocks.
Each rise brings more new editorial activity to the pool, producing a steady curve of newsroom momentum.
Interpretation:
The cumulative total at the end of the observation window strongly exceeds 120%, showing that the BBC homepage saw more than a complete turnover of its explicitly visible headlines during the period of the study of the website.
Not only what changed, but by how much and how emphatically each newsroom reacted to its news environment can be compared across outlets or days using these types of metrics.
Together, these levels of visual lighting are able to create a comprehensive image of editorial movement:
By fusing data collection via proxies with comparative visualization, such a methodology makes ephemeral page updates for the homepage into quantifiable editorial analytics.
More cross-verifiable evidence of how and when digital newsrooms transition, not through anecdote but through hard observable data.
Although the experiment involves taking the BBC homepage and turning our headlines into measurable editorial drift, its consequences are far more profound than a BBC homepage.
While starting as a technical workflow, which proxies, scrapes, and carries out timed comparisons, it morphs into a setup for media accountability, content intelligence, and data-science-based research.
The ability to measure when, how, and why editorials from the wild of digital change turn ephemeral editorial behavior into a structured dataset of wide practical value.
Drift analytics brings the power of evidence into media research.
By keeping track of and measuring all changes made to a publication's headlines, researchers are able to:
This turns conventional media criticism into quantitative media forensics where editorial decision-making can be compared and quantified across media operations or news cycles.
In the long term, such approaches could be part of newsroom compliance audits and trust-rating systems, or even for regulatory transparency systems.
Outside of academia, the opportunities for powerful applications of headline drift analysis are available to communication teams, public relations analysts, and content strategists.
Organizations can use similar monitoring pipelines to:
For PR professionals, this involves the ability to shift from measuring media exposure anecdotally to measuring it quantitatively.
Instead of recording nothing more than "mentions," analysts are able to flag the operational progression of stories through the news cycle from breaking news to quiet obituary.
This provides a new level of situational awareness in terms of reputation management and control of the message.
From a data science point of view, the continuous scraping and drift detection present an important variable that is seldom recognized in the design of a dataset: time.
Every dataset that is web-scraped is a temporal snapshot of time, so analyses constructed from static collections can easily fall into the trap of freshness bias and perceiving transient content as permanent.
Drift analytics addresses this by inserting tools for so-called temporal filters and version awareness directly into data pipelines.
Key implications include:
In data ecosystems that are becoming more and more dynamic, temporal analysis will become as important as spatial or semantic metadata.
Drift analytics are thus both a journalistic tool as well as a methodological defense mechanism for contemporary AI-powered media research.
Digital journalism has thus ceased to be the static deposition of the events of everyday life and has become a living and dynamic ecosystem. Every story that is found, every quick line of copy that's written, every change of tempo, every one-time removal of a story from the pages of a newspaper is the result of a living, breathing newsroom that's being able to come together to tell the real-time story of the world at work. Through the incommensurate tool of the newsroom drift, we start to see this constant flux not as madness, but as structure, rhythm, and intention.
Time is a breakup, just like geography is. Of course, the article that we remember in the morning may not even exist in the afternoon because it has either been rewritten or one of many different versions has been created as facts have changed and the context has shifted. This experiment serves to show that the web is not just a place for hosting information, but is instead rebuilt all the time, layer on layer, in a soundless choreography of editorial decisions. By maintaining a record of these shifts, drift analytics helps to shed visibility on a process that normally occurs out of the sight of the people who typically read from the screens.
This idea is realized by Massive's proxy network. It chiefly works by making access distributed and regionalised, but uninterested in throttling, localisation, and restricted access, allowing observers to experience the live timeline of newsroom edits unencumbered. Every refresh is a frame in a time-lapse movie about modern journalism, where the cadence of updates is just as important and meaningful as the stories themselves.
Ultimately, today's news are narrative vectors which must be studied through time to understand how news will deform, grow old, and disappear when attention and agenda allows it to do so. Some have argued that page archiving misses the point when discussing what is new; with drift analytics, we will see someone making that approach and looking more toward processes being developed and analyzed, and measuring what isn't only what's being said, but how often and how fast it's evolving.
I'm a software engineer with experience in designing, developing, and testing software for desktop and mobile platforms.
Copyright Massive; Massive is a registered trademark of Massive Computing, Inc.