

Mapping the Fractured Web: A Technical Guide to Measuring Geographic Bias with Proxies

Volodymyr Rudenko
Head of Engineering at Massive
October 14, 2025
It is important to understand that the World Wide Web that you may know is a ghost. We still believe in one and the same digital space where a developer in Tokyo and an analyst in Berlin can execute the same search query, and this means they can both see the same universal truth. It is good to think, it is not true. The web is not a monolith. It is a very fragmented, moving, and intimate place where what is physically there, determines what is digitally there. This is not a bug in the matrix, it is one of the fundamental characteristics of the current internet - an algorithmic, commercial Splinternet where geographic position is as effective as search query.
To us in the trenches - data scientists, developing world models, SEO experts, running international campaigns, market experts, following worldwide competitors - such fragmentation is more than an inconvenience. It is a really severe weakness in our data. How you view the world is not the truth on the ground, it is a localized, personalized, and often biased view. Business decisions made based on this distorted view are inevitably flawed, resulting in wasted ad dollars, strategies that fail to work, and a distorted vision of what the global marketplace is all about.
We need a new type of scientific tool in order to find our way over this ground. Previously being sent to simple tasks of anonymity, proxies have developed. They have become unquestionably important instruments of managing the variable of the location in any serious web data experiment. They allow us to systematically change our digital perch, to look through the window of a web-user in any metropolis, and to trace the lines of this discontinuous world with accuracy. It is your technical instructions for doing that. We will unpack how geographic bias works, taking you through a rigorous experiment to quantify it with the help of Python and showing you how to turn this into a decisive strategic advantage.
You must know what makes the web geometrically variable before you can measure its geographic variance. It is not just one phenomenon. It is a continuum of processes, ranging from intentional business strategies to the soft, institutional bias implicit in the very design of the web. This distinction is the first step to creating a data collection methodology that will be able to withstand scrutiny.

Filter bubble is a pretty good place to start, but it is too simplistic. It fails to understand the multi-dimensionality of geographic fragmentation. The differences in people from one country to another are created by invisible and visible hands, which chisel what you can see.
The most obvious form of fragmentation is that of geo-targeting. It is a multi-billion-dollar business that is built on a very simple premise. Search engines, e-commerce companies, and ad networks are actively using your location (your IP address, GPS, or Wi-Fi location) to personalize your experience. This is manifested in two ways:
Less obvious, and perhaps more powerful, is the systemic and algorithmic bias. Take the way traditional academic research is biased toward research in high-income, English-speaking countries. The same is true with the source data of the web. LLMs and search algorithms are designed and trained on vast quantities of scraped data from the internet. In case the training data is geographically unbalanced, these models will learn and perpetuate such biases. It can lead to inaccurate algorithms being used by underrepresented users or the definition of certain locations with negative stereotypes, which impacts not only search results but also automated content. Web architecture in this sense has an implicit perspective.
Legal & Regulatory Fragmentation
The highest degree of fragmentation is the law. Privacy laws like the GDPR of Europe or the VCDPA of Virginia create their own regulations on how data is processed and on consent for cookies and tracking users. This forces websites to adjust their functionality, features and ads presented to the user depending on their jurisdiction, further breaking up the global experience.
For a technical professional, working with a single-location perspective of the web is not only a hypothetical blind spot, but also the actual cause of risk and missed opportunities.
The point is as follows: the web is fragmented, so data about the ground truth is no longer a thing that you simply gather. It is something that needs to be engineered. Any data collection that does not control the geographic variable is, by default, contaminated by your own location. This is where proxies can cease being a mere tool of anonymity and be a key component of data integrity, as to creating a particular observer profile - say a mobile user in Sao Paulo - to obtain a particular, localized version of the truth.
We've laid out the theory. Now, let's get our hands dirty. This part gives a full, reproducible experiment, to estimate the effect of geographic bias in the real world. We will go through study design, proxy choice, Python code, and computation of the web fragmentation to quantify the web fragmentation.
A decent technical experiment is not just code; it is based on a sound methodology. This way, having our decisions be supported by existing theories, we transform this exercise into a piece of research that is credible, one that would be appealing to a technical audience that embraces rigor.
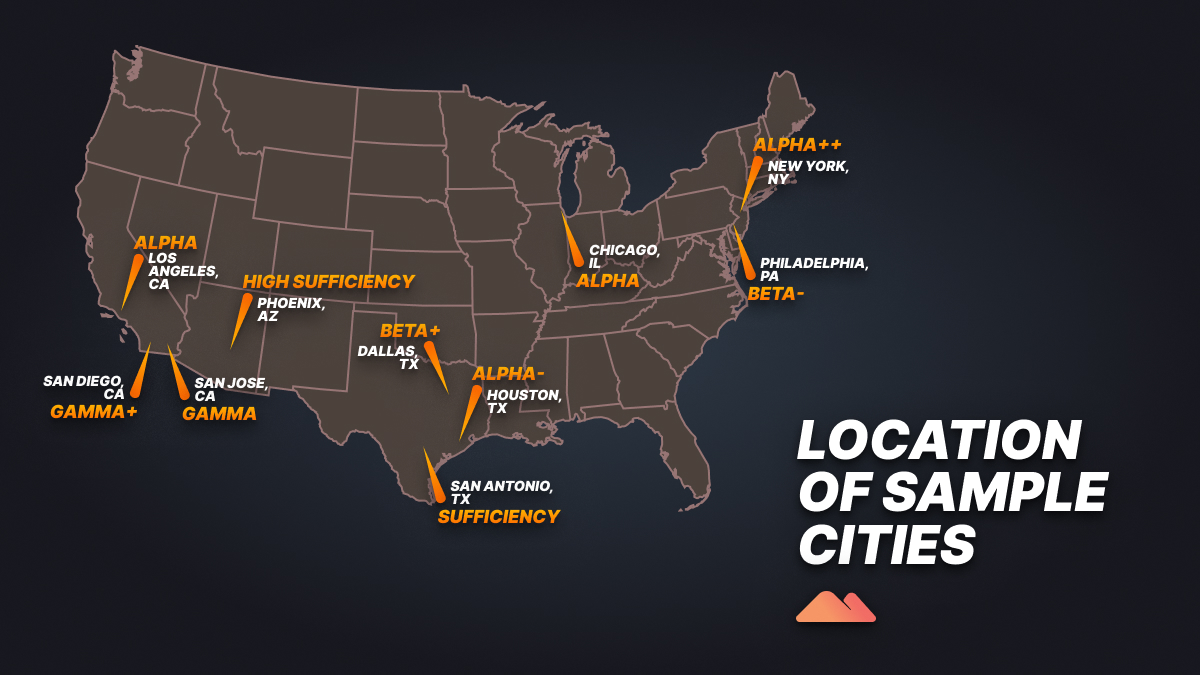
We will not include the cities in a hat, but rather we will rely on the classification system of the Globalization and World Cities (GaWC) Research Network. This model classifies cities in terms of the degree of their integration into the global economy. The sample that we obtain by selecting cities at various levels and continents is representative and defensible.
<table class="GeneratedTable">
<thead>
<tr>
<th>City</th>
<th>State</th>
<th>Country</th>
<th>Classification</th>
</tr>
</thead>
<tbody>
<tr><td><strong>New York</strong></td><td>New York</td><td>USA</td><td>Alpha ++</td></tr>
<tr><td><strong>Los Angeles</strong></td><td>California</td><td>USA</td><td>Alpha</td></tr>
<tr><td><strong>Chicago</strong></td><td>Illinois</td><td>USA</td><td>Alpha</td></tr>
<tr><td><strong>Houston</strong></td><td>Texas</td><td>USA</td><td>Alpha -</td></tr>
<tr><td><strong>Phoenix</strong></td><td>Arizona</td><td>USA</td><td>High Sufficiency</td></tr>
<tr><td><strong>Philadelphia</strong></td><td>Pennsylvania</td><td>USA</td><td>Beta -</td></tr>
<tr><td><strong>San Antonio</strong></td><td>Texas</td><td>USA</td><td>Sufficiency</td></tr>
<tr><td><strong>San Diego</strong></td><td>California</td><td>USA</td><td>Gamma +</td></tr>
<tr><td><strong>Dallas</strong></td><td>Texas</td><td>USA</td><td>Beta +</td></tr>
<tr><td><strong>San Jose</strong></td><td>California</td><td>USA</td><td>Gamma</td></tr>
</tbody>
</table>
To test three different hypotheses about geographic variance, we will use three different search queries, each of which is based on well-known models of user intent:
The kind of proxy you adopt is not only a technical consideration, but also a strategic decision that has an influence on the validity of your data. Choosing an inappropriate tool can not only lead to slower results, but also to completely incorrect results. Having a good provider of proxies means having more than just IPs, they are there to provide expertise. In this experiment, we require residential proxies and ISP proxies in order to see the big picture.
<table class="GeneratedTable">
<thead>
<tr>
<th>Feature</th>
<th>Residential Proxies</th>
<th>ISP Proxies</th>
</tr>
</thead>
<tbody>
<tr>
<td>IP Source</td>
<td>Real peer devices (e.g., home Wi-Fi)</td>
<td>Data centers (with ISP-assigned IPs)</td>
</tr>
<tr>
<td>Speed</td>
<td>Slower, variable</td>
<td>Faster, highly stable</td>
</tr>
<tr>
<td>Stability</td>
<td>Variable (depends on end-user connection)</td>
<td>High (data center infrastructure)</td>
</tr>
<tr>
<td>Geo-Targeting Granularity</td>
<td>High (city/neighborhood level)</td>
<td>Moderate (country/region level)</td>
</tr>
<tr>
<td>Detection Risk</td>
<td>Very Low</td>
<td>Low to Moderate</td>
</tr>
</tbody>
</table>
The experiment was put into place via a Python script that was made to collect and compare the search results from various cities. The simulation used a Massive ISP proxy to generate queries from ten geographically diverse U.S. metropolitan areas, with the system providing human geo-relevant search queries.
To ensure compliance and consistency, the study used the lightweight search endpoints of DuckDuckGo instead of Google, to get the top search results for every city and query combination. The data was then cleaned and standardized to the top ten unique domains and compared over locations. At last, the results were analyzed using an Average Precision (t_AP) correlation to determine the number of similarities and differences between search rankings between cities - revealing the measurable "Splinternet" effect discussed earlier.
import time
import random
import requests
import pandas as pd
from tqdm.auto import tqdm
from typing import List, Dict
from bs4 import BeautifulSoup
from urllib.parse import urlencode, urlparse, parse_qs, unquote

# Config
QUERIES = ["what is a blockchain","buy cloud hosting","best restaurants",]

CITIES = ["New York, NY","Los Angeles, CA","Chicago, IL","Houston, TX","Phoenix, AZ",
          "Philadelphia, PA","San Antonio, TX","San Diego, CA","Dallas, TX","San Jose, CA",]

# If True, query as "<q> in <city>"; if False, use plain "<q>"
CITY_IN_QUERY = True

# Pull deeper, then dedupe to top-10 unique domains
FETCH_K = 30
KEEP_K = 10

# Proxy (Massive)
USE_PROXY = True
PROXY_USER = "your_proxy_username"
PROXY_PASS = "your_proxy_password"
PROXY_HOST = "proxy.joinmassive.com"
PROXY_PORT = 8000                      # Standard proxy port, adjust if needed

HEADERS = {"User-Agent": ("Mozilla/5.0 (Windows NT 10.0; Win64; x64) ""AppleWebKit/537.36 (KHTML, like Gecko) ""Chrome/124.0.0.0 Safari/537.36"),
           "Accept-Language": "en-US,en;q=0.9",}
TIMEOUT = 25
RETRIES = 2
SLEEP_RANGE = (1.0, 2.2)

# DuckDuckGo Helpers
def ddg_html_url(q: str) -> str:
    """DuckDuckGo HTML endpoint (no-JS)."""
    return "https://html.duckduckgo.com/html/?" + urlencode({"q": q, "kl": "us-en"})


def ddg_lite_url(q: str) -> str:
    """DuckDuckGo Lite endpoint (very simple HTML)."""
    return "https://lite.duckduckgo.com/lite/?" + urlencode({"q": q, "kl": "us-en"})


def get_proxies():
    """Return requests proxies dict if proxy is enabled, else None."""
    if not USE_PROXY:
        return None
    auth = f"http://{PROXY_USER}:{PROXY_PASS}@{PROXY_HOST}:{PROXY_PORT}"
    return {"http": auth, "https": auth}


def decode_duck_redirect(href: str) -> str:
    """Extract real target URL from DDG redirect links."""
    if href.startswith("http"):
        return href
    parsed = urlparse(href)
    qs = parse_qs(parsed.query)
    if "uddg" in qs and qs["uddg"]:
        return unquote(qs["uddg"][0])
    return href


def parse_ddg_html(html: str, k: int) -> List[str]:
    """Parse up to k URLs from DDG HTML mode."""
    soup = BeautifulSoup(html, "html.parser")
    out, seen = [], set()
    blocks = soup.select("div.result, div.web-result")
    for b in blocks:
        a = b.select_one("a.result__a") or b.select_one("a.result__url")
        if not a:
            continue
        href = decode_duck_redirect(a.get("href", ""))
        if not href.startswith("http"):
            continue
        if href in seen:
            continue
        seen.add(href)
        out.append(href)
        if len(out) >= k:
            break
    return out


def parse_ddg_lite(html: str, k: int) -> List[str]:
    """Parse up to k URLs from DDG Lite mode."""
    soup = BeautifulSoup(html, "html.parser")
    out, seen = [], set()
    rows = soup.select("tr.result, tr")
    for row in rows:
        a = row.select_one("a.result-link") or row.select_one("a[href]")
        if not a:
            continue
        href = decode_duck_redirect(a.get("href", ""))
        if not href.startswith("http"):
            continue
        if href in seen:
            continue
        seen.add(href)
        out.append(href)
        if len(out) >= k:
            break
    return out


def fetch(url: str, proxies):
    """HTTP GET with headers/proxies/timeout."""
    return requests.get(url,headers=HEADERS,proxies=proxies,timeout=TIMEOUT,allow_redirects=True,)

def fetch_urls(q: str, proxies, k: int) -> List[str]:
    """Try DDG HTML, then Lite; small retry/backoff."""
    for _ in range(RETRIES):
        try:
            r1 = fetch(ddg_html_url(q), proxies)
            r1.raise_for_status()
            urls = parse_ddg_html(r1.text, k=k)
            if urls:
                return urls
        except requests.exceptions.RequestException:
            pass
        time.sleep(random.uniform(*SLEEP_RANGE))

    for _ in range(RETRIES):
        try:
            r2 = fetch(ddg_lite_url(q), proxies)
            r2.raise_for_status()
            urls = parse_ddg_lite(r2.text, k=k)
            if urls:
                return urls
        except requests.exceptions.RequestException:
            pass
        time.sleep(random.uniform(*SLEEP_RANGE))

    return []

# Normalization to DOMAIN
_STRIP_SUBS = ("www.", "m.", "amp.", "mobile.", "en.", "lm.", "r.", "news.")


def url_to_domain(u: str) -> str:
    """Normalize URL to comparable domain (drop common subdomains, ignore Google)."""
    try:
        netloc = urlparse(u).netloc.lower()
        for pre in _STRIP_SUBS:
            if netloc.startswith(pre):
                netloc = netloc[len(pre):]
        if "google." in netloc:
            return ""
        return netloc
    except Exception:
        return ""


def keep_top_unique_domains(urls: List[str], k: int) -> List[str]:
    """Keep first k unique domains in order."""
    out, seen = [], set()
    for u in urls:
        d = url_to_domain(u)
        if not d or d in seen:
            continue
        seen.add(d)
        out.append(d)
        if len(out) >= k:
            break
    return out

# τ_AP (AP correlation) on domains, in [0,1]
def ap_correlation_domains(list1: List[str], list2: List[str]) -> float:
    """
    τ_AP focuses on order agreement among common items.
    If there are fewer than 2 common domains, return 0.0 (no order signal).
    """
    common = [d for d in list1 if d in set(list2)]
    n = len(common)
    if n < 2:
        return 0.0

    pos2 = {d: i for i, d in enumerate(list2)}
    s = 0.0
    for i in range(1, n):
        di = common[i]
        inversions = sum(1 for j in range(i) if pos2[di] < pos2[common[j]])
        s += inversions / i

    tau_ap = 1.0 - 2.0 * s / (n - 1)
    return round((tau_ap + 1) / 2, 2)

# Main
def main() -> None:
    """Fetch SERPs, convert to domain lists, then display AP correlation matrices."""
    try:
        from IPython.display import display  # type: ignore
        HAVE_IPY = True
    except Exception:
        HAVE_IPY = False

    proxies = get_proxies()

    # results[query][city] = ranked list of top-10 unique domains
    results: Dict[str, Dict[str, List[str]]] = {q: {} for q in QUERIES}

    total_tasks = len(QUERIES) * len(CITIES)
    with tqdm(total=total_tasks, desc="Fetching SERPs", unit="task") as pbar:
        for q in QUERIES:
            for city in CITIES:
                q_city = f"{q} in {city}" if CITY_IN_QUERY else q
                urls = fetch_urls(q_city, proxies, k=FETCH_K)
                domains = keep_top_unique_domains(urls, k=KEEP_K)
                results[q][city] = domains
                pbar.update(1)

    # Display AP correlation matrices (domains) with a title per query
    for q in QUERIES:
        matrix = []
        for c1 in CITIES:
            row = []
            for c2 in CITIES:
                row.append(
                    ap_correlation_domains(
                        results[q].get(c1, []),
                        results[q].get(c2, []),)
                )
            matrix.append(row)

        df = pd.DataFrame(matrix, index=CITIES, columns=CITIES)

        if HAVE_IPY:
            display(df.style.format("{:.2f}").set_caption(f"\n\n=== AP Correlation Matrix for: {q} ==="))
        else:
            print(f"\n\n=== AP Correlation Matrix for: {q} ===")
            print(df.round(2))

if __name__ == "__main__":
    main()
This workflow has the ability to automate the entire geo-SERP experiment with minimal effort. It stands behind both proxy rotation per city and query, connection error handling, and clean ranking data parsing from DuckDuckGo. The resulting t_AP correlation matrices reveal clearly the variation of search results from city to city. In non-science terms, the experiment effectively converts web fragmentation from a concept to a measurable fact - and turns theory into something distinct and easily quantifiable, helpful to the analysis that follows.

After collecting the data, the analysis phase quantified the level of difference between the search results across locations. Instead of just the check of overlapping links, we used the Average Precision (t_AP) correlation, which compares the order of the top-ranked results and weights the differences at the top of the page. A score close to 1.00 indicates that two cities have nearly identical results, and scores closer to 0 indicate high divergence.
<table class="GeneratedTable">
<thead>
<tr>
<th>City</th>
<th>New York</th>
<th>Los Angeles</th>
<th>Chicago</th>
<th>Houston</th>
<th>Phoenix</th>
<th>Philadelphia</th>
<th>San Antonio</th>
<th>San Diego</th>
<th>Dallas</th>
<th>San Jose</th>
</tr>
</thead>
<tbody>
<tr><td>New York</td><td>1</td><td>1</td><td>0.75</td><td>0</td><td>0</td><td>0</td><td>0</td><td>1</td><td>0</td><td>1</td></tr>
<tr><td>Los Angeles</td><td>1</td><td>1</td><td>0.39</td><td>0</td><td>0</td><td>1</td><td>1</td><td>1</td><td>0.52</td><td>0.25</td></tr>
<tr><td>Chicago</td><td>0.75</td><td>0.67</td><td>1</td><td>0</td><td>0</td><td>0.25</td><td>1</td><td>0.72</td><td>0.39</td><td>0.88</td></tr>
<tr><td>Houston</td><td>0</td><td>0</td><td>0</td><td>1</td><td>0</td><td>1</td><td>1</td><td>0</td><td>0.5</td><td>0.61</td></tr>
<tr><td>Phoenix</td><td>0</td><td>0</td><td>0</td><td>0</td><td>1</td><td>0</td><td>0</td><td>1</td><td>1</td><td>0</td></tr>
<tr><td>Philadelphia</td><td>0</td><td>1</td><td>0.5</td><td>1</td><td>0</td><td>1</td><td>1</td><td>1</td><td>0.5</td><td>0.75</td></tr>
<tr><td>San Antonio</td><td>0</td><td>1</td><td>1</td><td>1</td><td>0</td><td>1</td><td>1</td><td>1</td><td>0.5</td><td>0.75</td></tr>
<tr><td>San Diego</td><td>1</td><td>0.62</td><td>0.78</td><td>0</td><td>1</td><td>0.25</td><td>0.25</td><td>1</td><td>0.72</td><td>0.67</td></tr>
<tr><td>Dallas</td><td>0</td><td>1</td><td>0.67</td><td>0.67</td><td>1</td><td>1</td><td>1</td><td>1</td><td>0.78</td><td>0.44</td></tr>
<tr><td>San Jose</td><td>1</td><td>0.5</td><td>0.88</td><td>0.61</td><td>0</td><td>0.75</td><td>0.75</td><td>0.75</td><td>0.39</td><td>0.56</td></tr>
</tbody>
</table>
There is uneven similarity of informational query in cities. Some pairs (eg, New York-Los Angeles, 1.00) have almost identical top results, with others (eg, Houston-Phoenix or New York-Phoenix, 0.00) having totally different results. This mixed pattern indicates that topics that are informational are partly still standardized nationally but show some influences of regional indexing as well as some noise from minor localization.
<table class="GeneratedTable">
<thead>
<tr>
<th>City</th>
<th>New York</th>
<th>Los Angeles</th>
<th>Chicago</th>
<th>Houston</th>
<th>Phoenix</th>
<th>Philadelphia</th>
<th>San Antonio</th>
<th>San Diego</th>
<th>Dallas</th>
<th>San Jose</th>
</tr>
</thead>
<tbody>
<tr><td>New York</td><td>1</td><td>0.72</td><td>1</td><td>1</td><td>0.75</td><td>1</td><td>0.83</td><td>1</td><td>1</td><td>1</td></tr>
<tr><td>Los Angeles</td><td>0.78</td><td>1</td><td>0.83</td><td>0.75</td><td>0.75</td><td>1</td><td>0.75</td><td>1</td><td>1</td><td>0.78</td></tr>
<tr><td>Chicago</td><td>0.83</td><td>1</td><td>1</td><td>1</td><td>0.75</td><td>0.75</td><td>1</td><td>1</td><td>1</td><td>1</td></tr>
<tr><td>Houston</td><td>1</td><td>0.75</td><td>1</td><td>1</td><td>1</td><td>1</td><td>1</td><td>0.75</td><td>1</td><td>1</td></tr>
<tr><td>Phoenix</td><td>0.75</td><td>0.75</td><td>1</td><td>1</td><td>1</td><td>1</td><td>1</td><td>1</td><td>1</td><td>1</td></tr>
<tr><td>Philadelphia</td><td>1</td><td>1</td><td>0.75</td><td>1</td><td>1</td><td>1</td><td>1</td><td>1</td><td>1</td><td>1</td></tr>
<tr><td>San Antonio</td><td>0.83</td><td>0.75</td><td>0.75</td><td>0.75</td><td>1</td><td>1</td><td>1</td><td>1</td><td>0.75</td><td>0.83</td></tr>
<tr><td>San Diego</td><td>1</td><td>1</td><td>1</td><td>1</td><td>1</td><td>0.75</td><td>1</td><td>1</td><td>1</td><td>1</td></tr>
<tr><td>Dallas</td><td>1</td><td>1</td><td>1</td><td>1</td><td>1</td><td>1</td><td>0.75</td><td>1</td><td>1</td><td>1</td></tr>
<tr><td>San Jose</td><td>1</td><td>0.72</td><td>1</td><td>1</td><td>1</td><td>1</td><td>0.83</td><td>1</td><td>1</td><td>1</td></tr>
</tbody>
</table>
The commercial query reveals that there is very high similarity across all cities- most values greater than 0.75 and many at 1.00 This indicates a nationally uniform SERP with global cloud service providers dominating results irrespective of city. In other words, transactional intent does little measurable fragmentation within the confines of the U.S. market.
<table class="GeneratedTable">
<thead>
<tr>
<th>City</th>
<th>New York</th>
<th>Los Angeles</th>
<th>Chicago</th>
<th>Houston</th>
<th>Phoenix</th>
<th>Philadelphia</th>
<th>San Antonio</th>
<th>San Diego</th>
<th>Dallas</th>
<th>San Jose</th>
</tr>
</thead>
<tbody>
<tr><td>New York</td><td>1</td><td>0.86</td><td>1</td><td>1</td><td>0.83</td><td>0.44</td><td>0.72</td><td>0.75</td><td>0.75</td><td>0.79</td></tr>
<tr><td>Los Angeles</td><td>0.85</td><td>1</td><td>1</td><td>1</td><td>0.71</td><td>0.25</td><td>0.72</td><td>0.83</td><td>0.83</td><td>0.83</td></tr>
<tr><td>Chicago</td><td>1</td><td>1</td><td>1</td><td>1</td><td>0.88</td><td>0.67</td><td>0.75</td><td>0.75</td><td>1</td><td>0.83</td></tr>
<tr><td>Houston</td><td>1</td><td>1</td><td>1</td><td>1</td><td>0.83</td><td>0.25</td><td>0.72</td><td>1</td><td>0.83</td><td>0.83</td></tr>
<tr><td>Phoenix</td><td>0.87</td><td>0.71</td><td>0.88</td><td>0.83</td><td>1</td><td>0.78</td><td>0.89</td><td>0.83</td><td>1</td><td>0.79</td></tr>
<tr><td>Philadelphia</td><td>0.56</td><td>0.5</td><td>0.39</td><td>0.5</td><td>0.72</td><td>1</td><td>1</td><td>0</td><td>1</td><td>0.61</td></tr>
<tr><td>San Antonio</td><td>0.78</td><td>0.78</td><td>0.75</td><td>0.78</td><td>0.89</td><td>1</td><td>1</td><td>1</td><td>1</td><td>0.89</td></tr>
<tr><td>San Diego</td><td>0.75</td><td>0.83</td><td>0.75</td><td>1</td><td>0.83</td><td>0</td><td>1</td><td>1</td><td>1</td><td>0.75</td></tr>
<tr><td>Dallas</td><td>0.75</td><td>0.83</td><td>1</td><td>0.83</td><td>1</td><td>1</td><td>1</td><td>1</td><td>1</td><td>1</td></tr>
<tr><td>San Jose</td><td>0.83</td><td>0.83</td><td>0.83</td><td>0.83</td><td>0.81</td><td>0.61</td><td>0.89</td><td>0.75</td><td>1</td><td>1</td></tr>
</tbody>
</table>
The "best restaurants" query is the one with the greatest variations between cities. Correlations remain high even in between big metro areas ([?] 0.75 - 1.00) but fall dramatically for some pairs - between Philadelphia or Houston and others - exhibiting localized personalization. This confirms that place-based intent is a factor that amplifies fragmentation, as SERPs are being focused on venues, maps, and local review aggregators in the vicinity.
The experiment also verifies an obvious hierarchy of geographic sensitivity across all three queries:
<table class="GeneratedTable">
<thead>
<tr>
<th>Query Type</th>
<th>Observed Pattern</th>
<th>Geo-Variance</th>
</tr>
</thead>
<tbody>
<tr>
<td>Informational</td>
<td>Partial overlap; some random divergence</td>
<td>Medium</td>
</tr>
<tr>
<td>Commercial</td>
<td>Uniform results dominated by global brands</td>
<td>Low</td>
</tr>
<tr>
<td>Local Intent</td>
<td>Distinct city-specific listings and directories</td>
<td>High</td>
</tr>
</tbody>
</table>
These quantitative results help turn the idea of a "Splinternet" into a quantitative reality. They show that even within one country, intent determines fragmentation: The more local the intent, the less consistent the search experience.

The experiment that we've conducted transcends the stratification of a research exercise; it is a blueprint for practical actionable decision making based on data. By systematically pinpointing and rectifying geographic bias, organizations are able to get from assumption to evidence. A proxy-based data pipeline will not only anonymise traffic, but it will also allow you to see the truth behind marketing in digital markets in an actual geo-relevant context. The following use cases explain how these insights then translate into quantifiable business benefits.
The Issue:
Even in one country, there is a difference in search visibility by city. Our experiment showed that "what is a blockchain" produced similar rankings across cities, whereas the "best restaurants" ranged immensely from New York to Houston or Philadelphia. And most SEO teams are still studying just national averages, losing examples of these local variations that will determine who actually shows up in front of customers.
The Proxy-Powered Solution:
Through the use of residential or ISP proxies, SEO analysts are able to simulate searches from various metro locations and compare the real ranking position.
This enables:
Keyword Discovery: Extracting long-tail keywords from Local SERPs, which are also referred to as People Also Ask, enables you to discover long-tail keyword opportunities that are specific to your region.
The Issue:
Digital advertisements can act differently by geographical location. Correlation results showed that even slight localization makes a difference -- the same ad creative may be shown against totally different content in a different city. Without independent verification, brands are unable to know where or how their ads are actually displayed.
The Proxy-Powered Solution:
Ad-verification networks depend on distributed proxies to surf the web in character as the entire real individual from certain regions.
This allows them to:
Creative Match: Ensure that the corresponding version of the ad and destination page is accurately presented to each location.
The Issue:
E-commerce, traveling, and SaaS markets have dynamic prices initiated by location. The specific search "buy cloud hosting", which yielded very similar results for most cities in the country, shows similarities in how markets are consolidated - but for less-homogenized markets, prices can be very different across cities.
The Proxy-Powered Solution:
By switching proxies at different locations, businesses can gather extensive prices from their competitors at different regions continuously.
This enables them to:
But the cost of establishing a robust proxy infrastructure is not a technical expense; it is a strategic asset, and our experiment demonstrated that geographic variability is quantified and thus made tractable. By being able to measure bias rather than blindly assume that it does not exist, companies can properly calibrate their marketing, pricing, and intelligence processes to the perceived reality of their actual users - turning the unknown into competitive symmetry.
To start with, we defied a myth that a single place, which we call the Web, really is one place. Using what can be expressed as a repeatably data-run experiment, we demonstrated that the internet is a fragmented and algorithmic ecology, where, even under the same query, diverse results can be dramatically applied differently from almost any location. The search experience in New York and Houston, for example, may be similar for information but very different for intent when it becomes local, such as in "best restaurants."
"System breakdown is not an academic quirk, but a fundamental fact of operating the modern internet." Every business, researcher or marketer still operating from a one-stop central view is really looking out at the world through a keyhole - sharp, but incomplete. To make informed, globally relevant decisions, we need to see the web as it is (and the web is as different users of the web see it: in different places, with different intentions).
The best ISP and residential proxies help in making this multiple-perspective view possible. Parliamentarians and governors are not merely locums of technology serving the water/cement function of data; if it is anything, they are the tools of data integrity and sites of strategic truth-testing. In a world where a single decision is based on trustworthy data, proxies are the way out of taking assumptions - key to converting geographical variance from a cause of distortion to a measurable, manageable, and ultimately profitable insight.
I'm a software engineer with experience in designing, developing, and testing software for desktop and mobile platforms.
Copyright Massive; Massive is a registered trademark of Massive Computing, Inc.